Case Study Date: 2015; 2019; 2021
Washington is a city on the North Carolinian coastline with a small population. It is prone to flooding due to its low-lying geography and proximity to surface water.
Brief Summary of Findings
The network of plan in Washington, NC reduces vulnerability to flooding but fails to target the physically more vulnerable areas. The network’s capacity in reducing vulnerability persists even when only concerning about its equity policies.
Plans Evaluated
- 2023 Comprehensive Plan
- Beaufort Hazard Mitigation Plan
- Parks and Recreation Comprehensive Master Plan
- Core Land Use Plan (CAMA)
Washington, NC
The precolonial city of Washington is located in Beaufort County on the North Carolinian coast with a 2010 population of 9,074. Since the 1990s, the city’s economy has been shifting toward tourism while its population increased 1.7% between 2000 and 2010. The city’s terrain averages about 10 feet above sea level, with slopes ranging from level to 4%. It is exposed to several recurring natural hazards, including hurricanes, floods, and Nor’easters (Beaufort County, 2010, as cited in Berke et al., 2015). Flooding due to storm surge and sea-level rise are the major threats because of the area’s low-lying land and proximity to surface water.
Findings of the Overall Network of Plans:
Washington’s network of plans has a mean policy score of 6.00, suggesting that it generally supports flooding vulnerability reduction. Despite the positive overall result, Washington’s plan network fails to target the physically more vulnerable districts. It is reflected by the negative Pearson’s r correlation (-0.39) between a district’s physical vulnerability and the summed policy score it receives. In fact, the negative correlation is the second greatest in Washington compared to the other five cities examined by the same study (Asbury Park, NJ; League City, TX; Fort Lauderdale, FL; Tampa, FL; Boston, MA), suggesting that Washington’s plan network has a strong focus on the less hazardous districts.
When concerning exclusively about equity policies, Washington’s plan network also has a positive mean policy score, which is the most positive result among the six cities being investigated by the same study. It suggests that the equity-policy portion of Washington’s plan network is integrated in addressing vulnerability in flooding, and it does so by a comparatively significant magnitude. The equity policies in Washington’s hazard mitigation plan and coastal land use plan do the most in reducing the flooding vulnerability of the socially vulnerable populations in the hundred-year floodplain throughout the city. The mitigation plan has a positive score because it contains equity policies aimed at floodplain land acquisition and relocation in the socially vulnerable neighborhoods (e.g., high levels of poverty, minority population, and low educational status). The coastal land use plan compliments the mitigation plan by including a policy that rezones the same acquired floodplain lands from residential land use to public parkland.
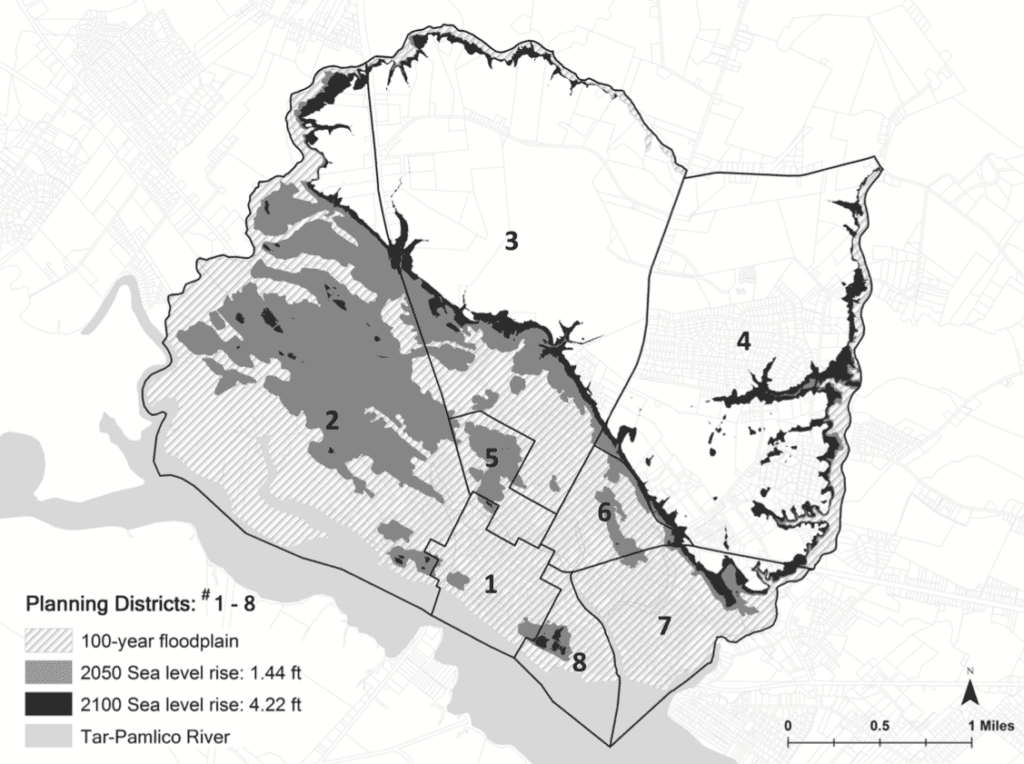
There has been a study examining the effect of Washington’s plan network on physical vulnerability and social vulnerability, respectively. The study delineated Washington into eight districts and two hazard zones – 100-year floodplain and sea-level rise zone. It was found that Washington’s plan network raised physical vulnerability in the 100-year floodplain of three districts while reduced physical vulnerability in the other five districts. For sea-level rise zones, however, the network heightened physical vulnerability for all the eight districts. Nonetheless, the relationship between the policy scores and the degree of physical vulnerability was not consistent. Most notably, the network strongly raised physical vulnerability in the downtown district (District 1; see Figure 1), which had the lowest score for both types of hazard zones (-4 in 100-year floodplain; –11 in sea-level rise area) but was in the highest quintile of physical vulnerability among all districts. This finding was due to the fact that both the CAMA Land Use Plan and the 2023 Comprehensive Plan focused on downtown and waterfront revitalization. They promoted smart growth principles by increasing densities, shifting single-use development to mixed-use development, incentivizing redevelopment and infill, and expanding public infrastructure investments to enhance pedestrian movement, amenities, and transit. These plans, however, do not consider the hazard implications of adding so much development in the vulnerable areas.

Note. Adapted from Evaluation of Networks of Plans and Vulnerability to Hazards and Climate Change: A Resilience Scorecard, by P. R. Berke, G. Newman, J. Lee, T. Combs, C. Kolosna, D. Salvesen, 2015, Journal of American Planning Association, 81(4), p.292 (https://doi.org/10.1080/01944363.2015.1093954). Copyright 2015 by American Planning Association, Chicago, IL.
District 6, however, was in the highest quintile of physical vulnerability for the 100-year floodplain but the plan network scored the highest (+4) in reducing physical vulnerability in the 100-year floodplain there. Plan policies for District 6 included land acquisition, rezoning to lower land use densities, and overlay zones to protect wetland vegetation that mitigated flooding. These were the kinds of plan elements that tended to reduce additional development in areas vulnerable to hazards.
Regarding to social vulnerability, the Washington’s plan network gave some attention to lowering social vulnerability in three districts (6, 7, and 8) but paid no attention to the remaining districts. The relationship between the level of social vulnerability and the strength of local plans was inconsistent. First, District 5 had the highest social vulnerability for 100-year floodplains and sea-level rise zones, but none of the plans included policies to reduce social vulnerability there. Second, of the three districts that received positive plan policy scores (6, 7, and 8 = +4), only District 7 had a significant level of social vulnerability. These three districts were the focus of a repetitive flood loss program that targeted low-income housing in the 100-year floodplain. The program included policies for property acquisition and relocation to nearby safer areas, and a zoning policy that designated the floodplain as a publicly owned greenway corridor.

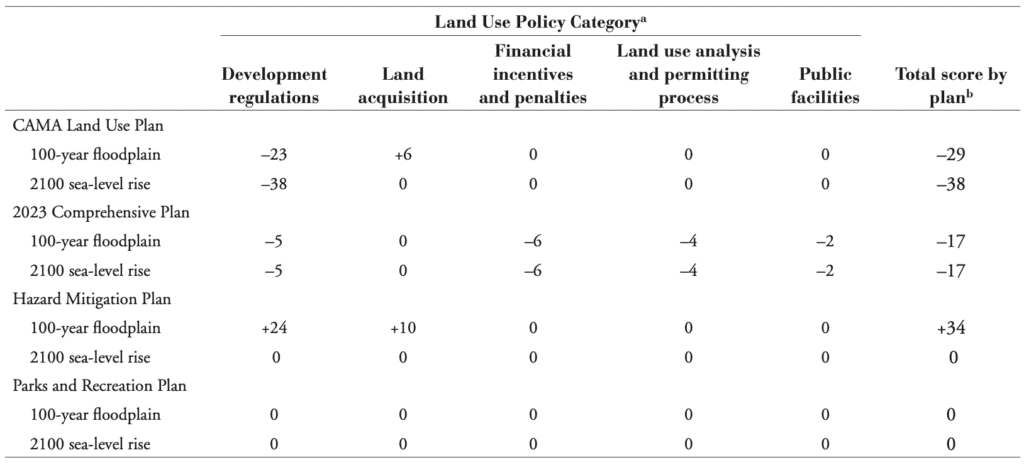
b The total score for each plan is the sum of scores across each land use policy categories by hazard zone.
Table 1: Composite scores for each plan by land use policy category that influence physical vulnerability across hazard zones (100-year floodplain and sea-level rise area).
Note. Adapted from Evaluation of Networks of Plans and Vulnerability to Hazards and Climate Change: A Resilience Scorecard, by P. R. Berke, G. Newman, J. Lee, T. Combs, C. Kolosna, D. Salvesen, 2015, Journal of American Planning Association, 81(4), p.298 (https://doi.org/10.1080/01944363.2015.1093954). Copyright 2015 by American Planning Association, Chicago, IL.
Table 1 shows the total scores for each plan and the total scores by land use policy category aimed at physical vulnerability. Most notable, the CAMA Land Use Plan policies and the 2023 Comprehensive Plan policies had strong negative scores that would lead to an increase in physical vulnerability in the 100-year floodplain (CAMA Land Use Plan = -29; 2023 Comprehensive Plan = -38) and projected sea-level rise zones (CAMA Land Use Plan = -17; 2023 Comprehensive Plan = -17; see Table 1). The CAMA Land Use Plan heightened physical vulnerability primarily because of its development regulations (e.g., raising zoning densities), while the 2023 Comprehensive Plan used a wider mix of policy instruments (regulations, incentives, permitting, and expansion of public facilities).
In contrast, the hazard mitigation plan policies had a strong positive score (+34) because they aimed to decrease physical vulnerability in the 100-year floodplain using development regulations and a land acquisition and relocation program. However, none of the policies was directed toward areas exposed to projected sea-level rise. The parks and recreation plan policies did not consider hazards and had no effect on physical vulnerability in both hazard zones because these plans emphasized maintenance, recreational activities for tourism, and environmental education.
Meanwhile, policies aimed at social vulnerability received no attention in the CAMA Land Use Plan, 2023 Comprehensive Plan, or the parks and recreation plan. The hazard mitigation plan had a moderate positive score because it contained policies aimed at reducing social vulnerability in the 100-year floodplain (+8). The policies in the mitigation plan focused on land acquisition and relocation as well as changes in zoning regulations from residential to permanent open space in flood-prone stream corridors in low-income neighborhoods.
References
Berke, P. R., Malecha, M. L., Yu, S., Lee, J., & Masterson, J. H. (2019a). Plan Integration for Resilience Scorecard: Evaluating Networks of Plans in Six US Coastal Cities. Journal of Environmental Planning and Management, 62(5), 901-920. https://doi.org/10.1080/09640568.2018.1453354
Berke, P. R., Newman, G., Lee, J., Combs, T., Kolosna, C., & Salvesen, D. (2015). Evaluation of Networks of Plans and Vulnerability to Hazards and Climate Change: A Resilience Scorecard. Journal of American Planning Association, 81(4), 287-302. https://doi.org/10.1080/01944363.2015.1093954
Berke, P. R., Yu, S., Malecha, M. L., & Cooper, J. (2019b). Plans that Disrupt Development: Equity Policies and Social Vulnerability in Six Coastal Cities. Journal of Planning Education and Research. https://doi.org/10.1177/0739456X19861144
Yu, S., Malecha, M. L., & Berke, P. R. (2021). Examining Factors Influencing Plan Integration for Community Resilience in Six US Coastal Cities Using Hierarchical Linear Modeling. Landscape and Urban Planning, 215, 104224. https://doi.org/10.1016/j.landurbplan.2021.104224

