Case Study Date: 2018
Feijenoord is a district in central Rotterdom, a city where the largest port in Europe is located in. The district is prone to both storm surge and riverine flooding but, fortunately, many parts of the district are protected against them by embankment and/or dike.
Summary of Findings
The network of plans has a positive overall policy score. However, the neighborhood- and plan-specific results are inconsistent. Some neighborhoods focus on development with insufficient attention to flood safety – to such a degree that their land use plan scores are negative.
Feijenoord District
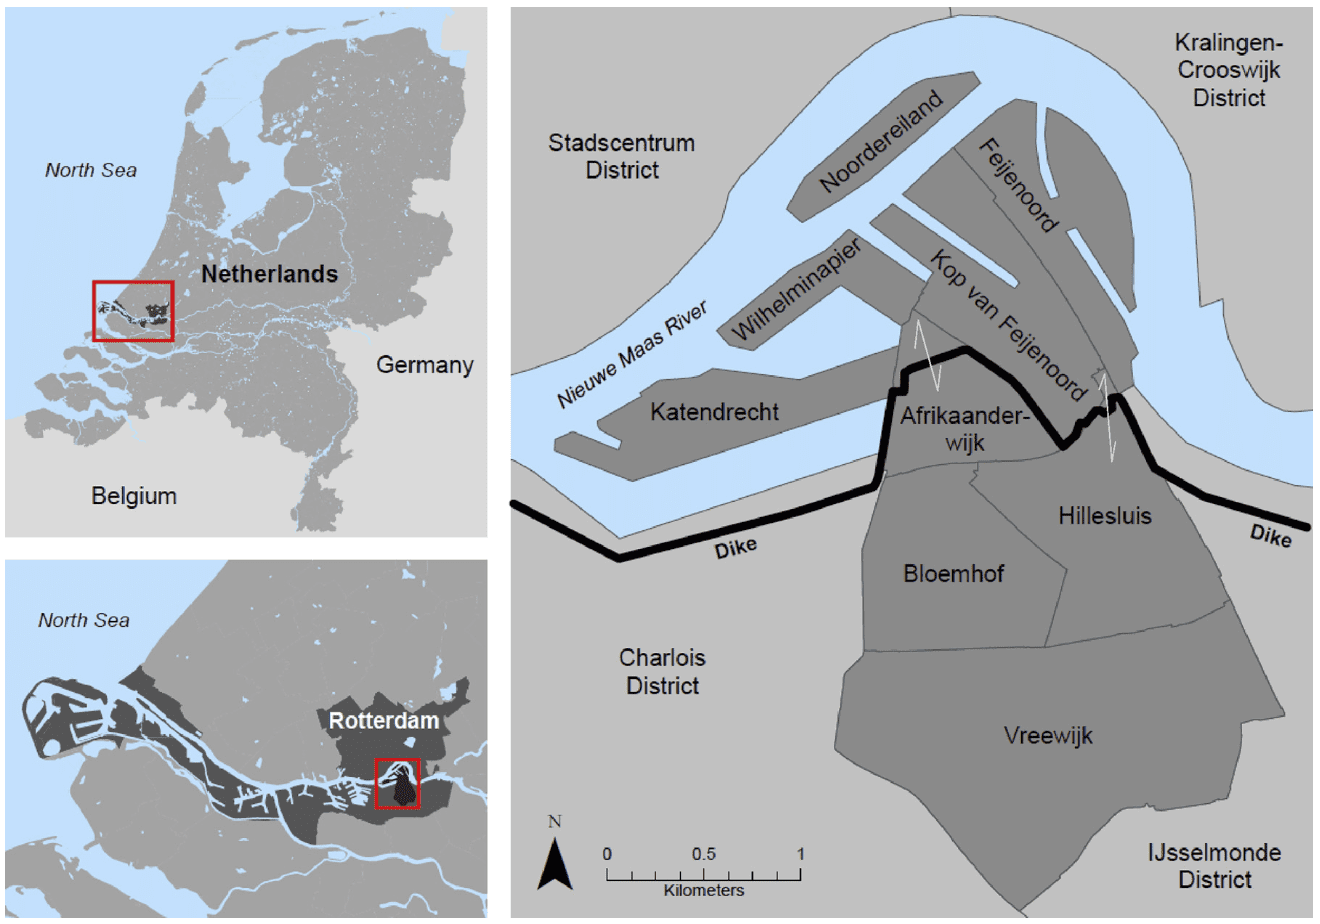
The district (wijk) of Feijenoord, located south of the Nieuwe Maas River in central Rotterdam, the second largest city in the Netherlands (2016 population: 616,260 (Centraal Bureau voor de Statistiek [CBS], 2016, as cited in Malecha et al., 2018)) and the largest port in Europe (see Figure 1). Feijenoord is a densely populated urban district with more than 70,000 residents (CBS, 2016, as cited in Malecha et al., 2018). The city is exposed to both storm surge and riverine flooding, although engineering works reduce some of the risks (City of Rotterdam, 2013, as cited in Malecha et al., 2018; de Moel et al., 2013). Feijenoord’s nine neighborhoods (buurten), shown in Figure 1, are among the areas most vulnerable to flooding in Rotterdam (CBS, 2016, as cited in Malecha et al., 2018).
Note. Adapted from Spatially Evaluating a Network of Plans and Flood Vulnerability Using a Plan Integration for Resilience Scorecard: A Case Study in Feijenoord District, Rotterdam, the Netherlands, by M. L. Malecha, A. D. Brand, P. R. Berke, Land Use Policy, 78, p.150 (https://doi.org/10.1016/j.landusepol.2018.06.029). Copyright 2018 by Elsevier Ltd.
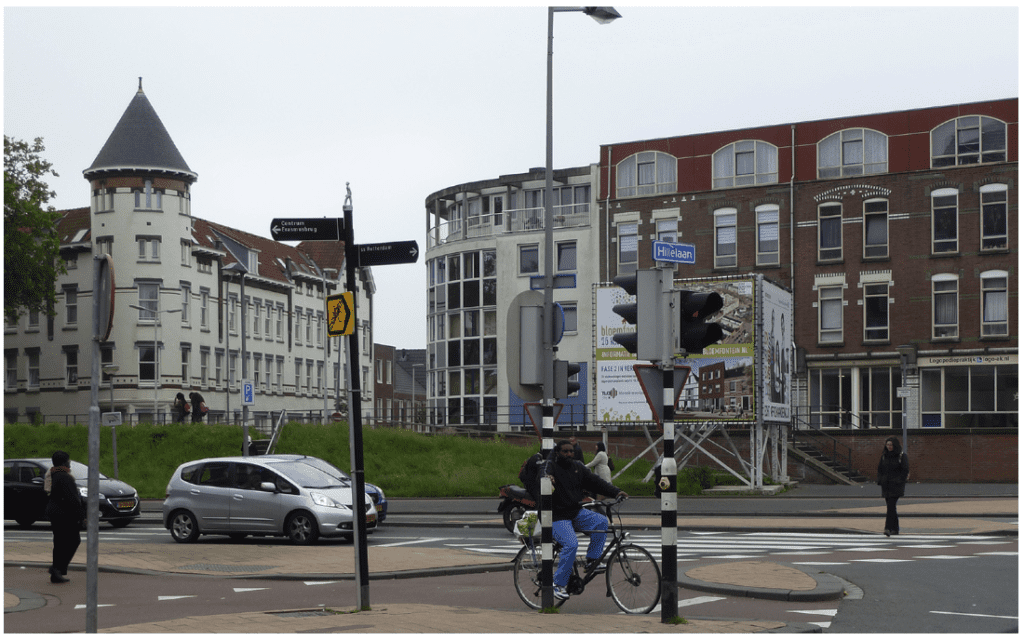
Like much of Rotterdam, the majority of southern Feijenoord District is located below sea level but is is protected from riverine flooding by an extensive dike and/or embankment system (City of Rotterdam, 2013, as cited in Malecha et al., 2018; Ward et al., 2013). More than half of Feijenoord’s land area – including the neighborhoods of Vreewijk, Bloemhof, the majority of Afrikaanderwijk, and all but a small portion of Hillesluis – is located behind the south bank dike (Figure 1). These predominately residential neighborhoods are almost entirely built-up. Figure 3 shows the appearance of the dike in the Afrikaanderwijk neighborhood. Flood safety in embanked areas is the responsibility of the regional Water Authority, which produces the required water plan and maintains the dikes to prevent overtopping or failure (Correljé and Broekhans, 2015). A very high safety standard has been set by the Dutch national government. Therefore, the annual flood risk in the embanked part of Feijenoord District is estimated at 1 in 4000 (Jonkman et al., 2008). In the unlikely event of a dike breach or extraordinarily high river levels, however, damage to the low-lying neighborhoods can be catastrophic (City of Rotterdam, 2013, as cited in Malecha et al., 2018).
Note. Adapted from Spatially Evaluating a Network of Plans and Flood Vulnerability Using a Plan Integration for Resilience Scorecard: A Case Study in Feijenoord District, Rotterdam, the Netherlands, by M. L. Malecha, A. D. Brand, P. R. Berke, Land Use Policy, 78, p.150 (https://doi.org/10.1016/j.landusepol.2018.06.029). Copyright 2018 by Elsevier Ltd. [Original source: Bobbink, 2013].
Note. Adapted from Spatially Evaluating a Network of Plans and Flood Vulnerability Using a Plan Integration for Resilience Scorecard: A Case Study in Feijenoord District, Rotterdam, the Netherlands, by M. L. Malecha, A. D. Brand, P. R. Berke, Land Use Policy, 78, p.151 (https://doi.org/10.1016/j.landusepol.2018.06.029). Copyright 2018 by Elsevier Ltd.
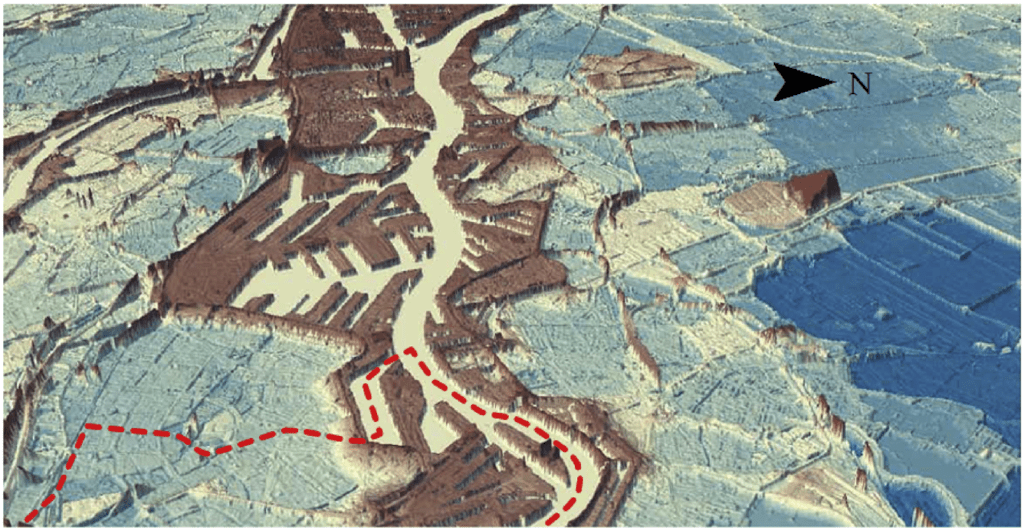
The remainder of the district – including Noordereiland, Feijenoord, Kop van Feijenoord, and the rapidly redeveloping Wilhelminapier and Katendrecht neighborhoods, as well as parts of Afrikaanderwijk and Hillesluis – is located on higher ground but is unembanked. Being directly exposed to the river (see Figure 4), these neighborhoods have a greater probability of flooding compared to the embanked neighborhoods, though inundation and damages are mitigated by higher elevation and by the Maeslant storm surge barrier (Maeslantkering), which prevents storm surges from the North Sea (City of Rotterdam, 2013, as cited in Malecha et al., 2018). In sharp contrast with the embanked areas, where flood safety (through prevention) is the sole responsibility of the regional Water Authority, responsibilities in unembanked areas are relatively ambiguous. According to the Dutch national policy regarding the riverbeds (Beleidslijn Grote Rivieren), individual developers are responsible for damage to new developments, whereas the municipality is in charge of public spaces and may contribute to flood response through provisions included in spatial and evacuation plans (Neuvel & van den Brink, 2009; Runhaar et al., 2012; Ward et al., 2013).

Note. Adapted from Spatially Evaluating a Network of Plans and Flood Vulnerability Using a Plan Integration for Resilience Scorecard: A Case Study in Feijenoord District, Rotterdam, the Netherlands, by M. L. Malecha, A. D. Brand, P. R. Berke, Land Use Policy, 78, p.151 (https://doi.org/10.1016/j.landusepol.2018.06.029). Copyright 2018 by Elsevier Ltd. [Original source: City of Rotterdam, 2013]
Findings of the Overall Network of Plans:
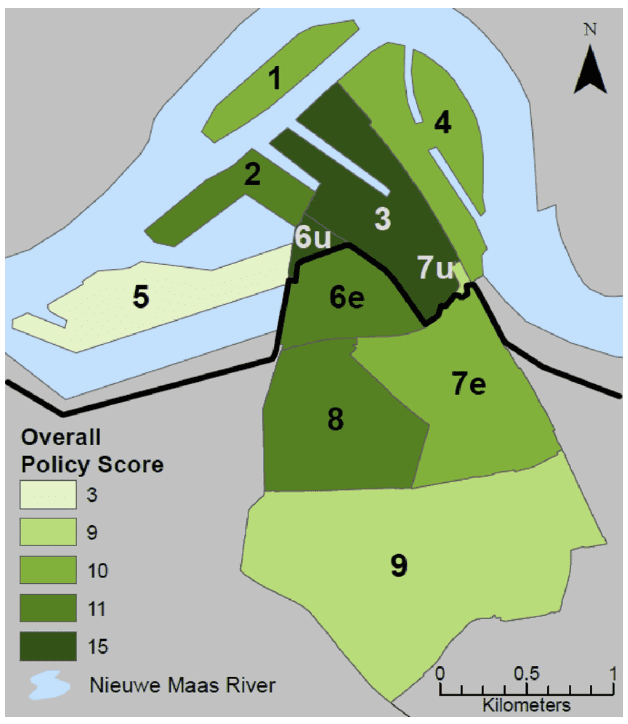
To facilitate comparison and description, neighborhood hazard zones have been assigned numbers and, in the case of neighborhoods in both hazard zones, letters (e.g., ‘6u for the unembanked portion of Afrikaanderwijk, ‘7e’ for the embanked portion of Hillesluis; see Figure 5).
Note. Adapted from Spatially Evaluating a Network of Plans and Flood Vulnerability Using a Plan Integration for Resilience Scorecard: A Case Study in Feijenoord District, Rotterdam, the Netherlands, by M. L. Malecha, A. D. Brand, P. R. Berke, Land Use Policy, 78, p.153 (https://doi.org/10.1016/j.landusepol.2018.06.029). Copyright 2018 by Elsevier Ltd.
When scores are summed across all three plan categories, all neighborhood hazard zones receive positive overall policy scores (overall mean = 10.4; unembanked mean = 10.4; embanked mean = 10.3), indicating that the network of plans emphasizes vulnerability reduction across Feijenoord District (Figure 5). When compared to the application of the scorecard method in the small city of Washington, North Carolina (Berke et al., 2015) – which produced mixed results and identified multiple areas of high plan conflict – this suggests that plan integration is stronger in Feijenoord, a result consistent with known differences between the two communities in terms of planning capacity and flood mitigation priorities.
The Dutch planning system mandates vertical and encourages horizontal integration of spatial plans (van der Valk, 2002). Combined with deliberate municipal (and national) prioritization of flood resilience, this is reflected in high plan scores, especially when compared to the U.S. example. The overall policy score results thus provide support for the scorecard method’s validity. The results are also a testament to the advanced state of planning and flood risk management in Rotterdam.
Despite the generally positive results, however, the overall policy scores vary considerably from the mean in Feijenoord’s unembanked neighborhoods (std. dev. = 3.8); they are more consistent in the embanked part of the district (std. dev. = 0.8). This suggests differences in both the goals and the spatial foci of the individual documents in the network of plans. These variations and their significance are the subject of the remainder of this discussion.
Policy Scores by Type of Plan and Hazard Zone
Disaggregating the scorecard results by type of plan and hazard zone (Table 3) allows a deeper look at the policy approach to flood vulnerability in Feijenoord District. Land use plans have the lowest mean neighborhood score (0.5) as a result of their focus on land use, including (re)development. They also display the highest standard deviation (3.3), likely reflecting their hyper-local focus – each neighborhood has its own land use plan according to its particular needs and goals.
Not surprisingly, the adaptation strategy has the highest mean neighborhood score (8.5) across Feijenoord’s network of plans. It is clearly focused on increasing flood resilience throughout the district, though somewhat more so in the unembanked neighborhoods. Scores for the water plan are more modest (mean = 1.4) and are considerably higher in the embanked part of the district than in the unembanked areas.

Note. Adapted from Spatially Evaluating a Network of Plans and Flood Vulnerability Using a Plan Integration for Resilience Scorecard: A Case Study in Feijenoord District, Rotterdam, the Netherlands, by M. L. Malecha, A. D. Brand, P. R. Berke, Land Use Policy, 78, p.153 (https://doi.org/10.1016/j.landusepol.2018.06.029). Copyright 2018 by Elsevier Ltd.
Spatial Distribution of Individual Plan Scores
Observing the scorecard results disaggregated by plan type and at the individual neighborhood scale permits an even more nuanced analysis of the network of plans. Scores are a window onto both existing conditions and spatial differences in plan emphasis. In Feijenoord, land use plans reflect current development pressures as well as individual neighborhood goals, which vary widely across the district (Figure 6a). The sub-municipal water plan (Figure 6b) and climate change adaptation strategy (Figure 6c) both broadly reduce flood vulnerability, but affect Feijenoord’s constituent neighborhoods in different ways. As demonstrated below, assessment of neighborhood-level disparities using the Plan Integration for Resilience Scorecard enables a richer understanding of the dynamics of the community’s network of plans.
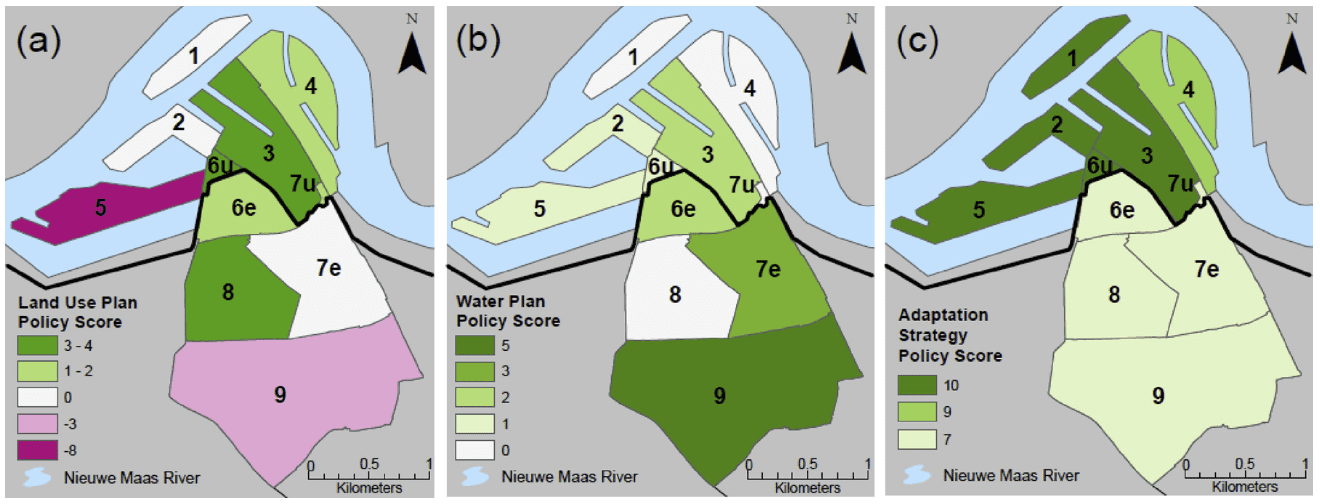
Note. Adapted from Spatially Evaluating a Network of Plans and Flood Vulnerability Using a Plan Integration for Resilience Scorecard: A Case Study in Feijenoord District, Rotterdam, the Netherlands, by M. L. Malecha, A. D. Brand, P. R. Berke, Land Use Policy, 78, p.154 (https://doi.org/10.1016/j.landusepol.2018.06.029). Copyright 2018 by Elsevier Ltd.
Spatial Distribution of Individual Plan Scores – Land Use Plan Scores
The unembanked portion of Feijenoord District is currently the focus of substantial public and private attention as part of a city-led push to attract middle- and upper-income residents. Several neighborhoods are undergoing a transition that includes redevelopment and infill as their abandoned port-related facilities are converted to modern residential districts, and this is reflected in their land use plan scores (Figure 6a). In some places, development pressures challenge the attention given to flood resilience, resulting in land use policies that may increase flood vulnerability. The Katendrecht neighborhood (#5) exemplifies this conflict as it evolves from an industrial brownfield site to a residential and mixed-use community. Katendrecht’s two land use plans (one for the ‘core’, or kern, and one for the ‘wrist’, or pols) include multiple policies aimed at increasing density on the peninsula, often noting the proximity of the harbor basins for their amenity value, but not acknowledging the potential hazard (e.g. ‘[T]he Pols-site is to be … transformed into a mixed, urban residential, working and leisure-district, using the recreational potential of the vicinity of the water’ (Bestemmingsplan Katendrecht-Pols, 2011, p.17, as cited in Malecha et al., 2018)).
Development pressure is less intense in Feijenoord’s more established embanked neighborhoods, where opportunities for infill and redevelopment are limited. The variations in land use plan policy scores there are more often driven by priorities for how to improve spatial quality and the built environment. Neighborhoods like Bloemhof (#8) and Afrikaanderwijk (#6e) are made more resilient by policies focused on modernization and the improvement of public spaces and drainage (e.g., ‘Sites where green is permitted are to be used for parks, public utilities, playgrounds … and other necessities of water management, like embankments and revetments’ (Bestemmingsplan Bloemhof, 2007, p.62, as cited in Malecha et al,. 2018)). However, with its ‘conservative’ land use plan, Vreewijk (#9) is less affected by this positive attention, and several redevelopment-related policies are actually likely to raise vulnerability in the event of a flood (e.g., ‘Dordtsestraatweg 603-611, a mixed use site, will be redeveloped into 20 apartments divided over four floors, with a new underground parking lot’ (Bestemmingsplan Vreewijk, 2010, p.27, as cited in Malecha et al., 2018)).
Spatial Distribution of Individual Plan Scores – Sub-Municipal Water Plan Scores
Results from the scorecard analysis indicate that Feijenoord District’s water plan (Figure 6b) accomplishes its mandated objective – and even strives to do more. Water Authorities are enabled by Dutch law to produce plan documents in collaboration with municipalities that manage water availability, movement, and quality in their jurisdictions (Tromp et al., 2014). With regard to flood resilience, these plans are mainly concerned with water drainage and retention. Unembanked parts of the city have been designed to allow precipitation to drain to the river directly, and thus policies aimed at improving water storage are generally not needed in these areas. Rotterdam’s water plans are progressive, however, expanding beyond the mandated intent and pooling staff and fiscal resources; even unembanked neighborhoods are positively affected by some water plan policies.
Still, because the task of managing water is more complicated in areas that cannot naturally drain to the river, Feijenoord’s progressive water plan focuses more on the embanked neighborhoods. A greater number of resilience-building policies in the water plan apply to Vreewijk (#9) and the embanked part of Hillesluis (#7e) than anywhere else. This may indicate that the water plan is working to fill policy gaps in the land use plans related to flooding – compare Figure 6b to 6a for these embanked neighborhoods.
Spatial Distribution of Individual Plan Scores – Climate Change Adaptation Strategy Scores
Finally, it is apparent from the scorecard results that Rotterdam’s citywide climate change adaptation strategy (Figure 6c) offers many innovative approaches for building flood resilience throughout Feijenoord District (again, mean policy score = 8.5), but especially in unembanked neighborhoods (mean = 9.4). Like the water plan, the adaptation strategy is generally concerned with flooding, but it is more focused on the threats posed by impending climate change and from the Nieuwe Maas. Hence, greater policy attention is given to the unembanked part of the district (e.g., ‘In order to be able to design and build robust waterproof constructions [in Kop van Feijenoord and Noordereiland], new building regulations are being developed’ (City of Rotterdam, 2013, p.70, as cited in Malecha et al., 2018)). This emphasis on unembanked neighborhoods again represents an attempt to fill policy gaps; Rotterdam is using the adaptation strategy to strengthen flood resilience in the increasingly vulnerable unembanked areas, which receive relatively little attention from the water plan.
References
Malecha, M. L., Brand, A. D., & Berke, P. R. (2018). Spatially Evaluating a Network of Plans and Flood Vulnerability Using a Plan Integration for Resilience Scorecard: A Case Study in Feijenoord District, Rotterdam, the Netherlands. Land Use Policy, 78, 147-157. https://doi.org/10.1016/j.landusepol.2018.06.029
Berke, P. R., Newman, G., Lee, J., Combs, T., Kolosna, C., & Salvesen, D. (2015). Evaluation of Networks of Plans and Vulnerability to Hazards and Climate Change: A Resilience Scorecard. Journal of American Planning Association, 81(4), 287-302. https://doi.org/10.1080/01944363.2015.1093954
de Moel, H., van Vliet, M., & Aerts, J. C. J. H. (2013). Evaluating the Effect of Flood Damage-Reducing Measures: A Case Study of the Unembanked Area of Rotterdam, the Netherlands. Regional Environmental Change, 14, 895-908. https://doi.org/10.1007/s10113-013-0420-z
Ward, P. J., Pauw, W. P., van Buuren, M. W., & Marfai, M. A. (2013). Governance of Flood Risk Management in a Time of Climate Change: The Cases of Jakarta and Rotterdam. Environmental Politics, 22(3), 518-536. https://doi.org/10.1080/09644016.2012.683155
Correljé, A., & Broekhans, B. (2015). Flood Risk Management in the Netherlands After the 1953 Flood: A Competition Between the Public Values(s) of Water. Journal of Flood Risk Management, 8, 99-115. https://doi.org/10.1111/jfr3.12087
Jonkman, S. N., Kok, M., & Vrijling, J. K. (2008). Flood Risk Assessment in the Netherlands: A Case Study for Dike Ring South Holland. Risk Analysis: An International Journal, 28(5), 1357-1374. https://doi.org/10.1111/j.1539-6924.2008.01103.x
Neuvel, J. M. M., & van den Brink, A. (2009). Flood Risk Management in Dutch Local Spatial Planning Practices. Journal of Environmental Planning and Management, 52(7), 865-880. https://doi.org/10.1080/09640560903180909
Runhaar, H., Mees, H., Wardekker, A., van der Sluijs, J., & Driessen, P. P. J. (2012). Adaptation to Climate Change-Related Risks in Dutch Urban Areas: Stimuli and Barriers. Regional Environmental Change, 12, 777-790. https://doi.org/10.1007/s10113-012-0292-7
van der Valk, A. (2002). The Dutch Planning Experience. Landscape and Urban Planning, 58(2-4), 201-210. https://doi.org/10.1016/S0169-2046(01)00221-3Get
Tromp, E., Rengers, J., van den Berg, H., & Pelders, E. (2014). Levees in a Changing Environment: Flexible, Strategic Planning. The 6th International Conference on Flood Management, Sao Paulo, Brazil.

